

Uptime Kuma: monitor all your self-hosted services and get alerted
The more services you self-host, the more you need to know when one breaks — before someone in the house discovers it. Uptime Kuma is a single-container monitor that checks your services every minute and messages you the moment one goes down, and again when it recovers.
Published Nov 17, 2026 · Last updated Nov 18, 2026
Self-hosting has a quiet failure mode: nothing announces a problem. The photo backup stops because a container exited. The media server is fine but its reverse proxy certificate expired. The document archive’s database container is down, so the web page returns an error only when someone actually visits. Uptime Kuma, a free and open-source project inspired by commercial uptime services, replaces discovery-by-accident with discovery-by-alert. It is often the second container people install and the one they end up valuing most, because it watches all the others.
What a monitor actually is
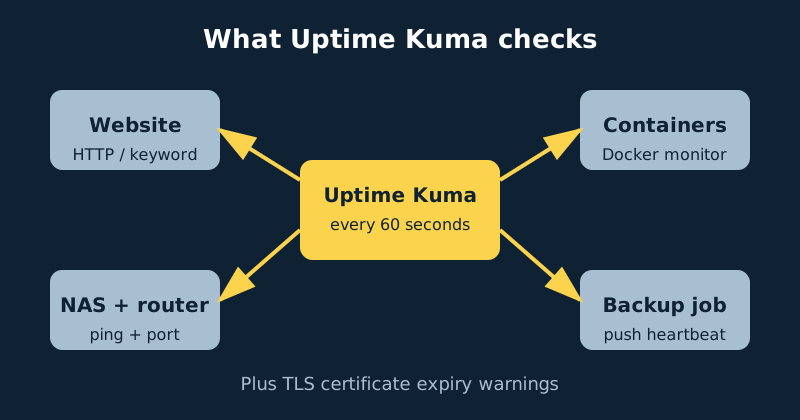
A monitor is one thing to check, how to check it, and how often. Uptime Kuma supports more than thirty monitor types; a home server needs about six of them. An HTTP(s) monitor fetches a URL and expects a healthy status code. An HTTP keyword monitor also requires a word to be present (or absent) in the response, which catches the nasty case of a page that loads but shows an error. A JSON query monitor checks an API health endpoint properly. A TCP port monitor just confirms a port accepts connections — right for databases and other services with no web page. Ping checks a machine is reachable at network level. A Docker container monitor reports whether a container is running, and a Push monitor works in reverse: a backup job or scheduled script pings a special URL when it succeeds, and Kuma alerts you if that ping stops arriving. Kuma also tracks TLS certificate expiry for HTTPS services and warns you before a certificate lapses.
What you need
- Docker and Docker Compose on the NAS or server you want to watch — or, better, a second small device (see the blind-spot warning below).
- One persistent volume for Kuma’s data folder. All monitors, history and settings live there, in its own database. That single folder is the entire backup.
- A notification channel you will actually notice: email (SMTP), a chat app, or a push service. Kuma supports more than 90 notification providers, including Telegram, Discord, Slack, Microsoft Teams, Signal via bridges, Pushover, ntfy, Gotify, generic webhooks and Apprise, which itself fans out to many more.
- A list of your services with their addresses and ports. Ten minutes with a notebook now makes setup a simple data-entry exercise.
The blind spot, stated honestly: if Kuma runs on the same NAS as everything else and the NAS dies or the home internet drops, Kuma cannot send alerts — the messenger is down with the patient. Serious setups run a second tiny Kuma instance elsewhere (a cheap VPS or a relative’s house) watching the home connection and the main Kuma, or accept the gap knowingly for a home lab. Decide consciously; do not discover it during an outage.
Step-by-step installation
- Write the compose file (example below) and start it with
docker compose up -d. Kuma listens on port 3001. - Open
http://your-server-address:3001and create the administrator account on first launch. There is no default password to forget to change — the account you create is the account. Make it strong and unique. - Set up notifications before monitors. Go to Settings › Notifications, add your channel (for example an SMTP email, a Telegram bot, or an ntfy topic), and use the Test button. Do not proceed until a test message actually arrives on your phone — an untested alert channel is decoration.
- Add your first monitor: New Monitor, type HTTP(s), a friendly name, the service’s URL, and a heartbeat interval of 60 seconds. Set retries to 2 or 3 so a single glitch does not wake you, and make sure your notification channel is ticked for this monitor. Save and watch it turn green.
- Add the rest by type: a keyword monitor for any service with a status or login page (require a word that only appears when it works); TCP port monitors for databases and non-web services; a ping monitor for the router and the NAS itself; Docker monitors for your most important containers if you give Kuma access to the Docker socket (read the security note in troubleshooting before doing this).
- Add a Push monitor for backups. Create the monitor, copy its push URL, and add a one-line
curlcall to the end of your backup script so it pings that URL only when the backup completes successfully. Set the interval to slightly longer than your backup schedule. Now a silently failing backup job alerts you by its absence — the most valuable monitor most people never think of. - Tune intervals and retries per importance. Core services: 60 seconds. Nice-to-have services: 5 minutes. Certificates and slow-changing things are tracked automatically. The goal is alerts you trust, which means few enough false alarms that you never mute the channel.
- Create a status page under Status Pages: pick the monitors to show, give it a name, and save. You get a clean public-style page — handy as a household “is it me or is it down?” link, and you can keep it on the local network only if you prefer.
- Back up the data volume. Stop-gap measures do not exist here: that one folder is your entire configuration and history. Include it in the same backup routine as your other containers, and after any big setup session, export or copy it once by hand so a known-good version exists.
A concrete Docker Compose example
services:
  uptime-kuma:
    image: louislam/uptime-kuma:1
    container_name: uptime-kuma
    ports:
      - "3001:3001"
    volumes:
      - ./data:/app/data
      # Optional, for Docker container monitors only:
      # - /var/run/docker.sock:/var/run/docker.sock
    restart: unless-stopped
Pinning to the major version tag (:1) rather than latest is deliberate: Kuma’s newer major releases can change the database, and you want upgrades to be a decision, not a surprise. The commented-out Docker socket line is left disabled on purpose — mounting the socket gives the container effectively full control of Docker on the host, so enable it only if you actively use Docker monitors and understand that trade-off; a socket proxy with limited permissions is the safer pattern.
Optional: Docker monitors through a socket proxy. A socket proxy is a small extra container that sits between Kuma and the real Docker socket, forwarding only the API calls you explicitly allow. The proxy is the only container that mounts the socket, and it mounts it read-only; Kuma never touches the socket directly. Add a proxy service alongside Kuma, granting just the read access container monitors need:
  socket-proxy:
    image: tecnativa/docker-socket-proxy
    container_name: socket-proxy
    environment:
      CONTAINERS: 1   # allow reading container state — all Kuma needs
      POST: 0         # nothing may be created, started or changed
    volumes:
      - /var/run/docker.sock:/var/run/docker.sock:ro
    restart: unless-stopped
Then, in Kuma, go to Settings › Docker Hosts, add a host of type TCP pointing at tcp://socket-proxy:2375, and choose it on your Docker monitors. Be clear-eyed about the limit: a proxy reduces the risk, it does not eliminate it — the proxy itself still holds the socket, and even a read-only view of your containers is information worth protecting. And if you only monitor websites and services, you do not need Docker monitors at all: skip the socket entirely unless you understand what you are granting.
Writing alerts people do not mute
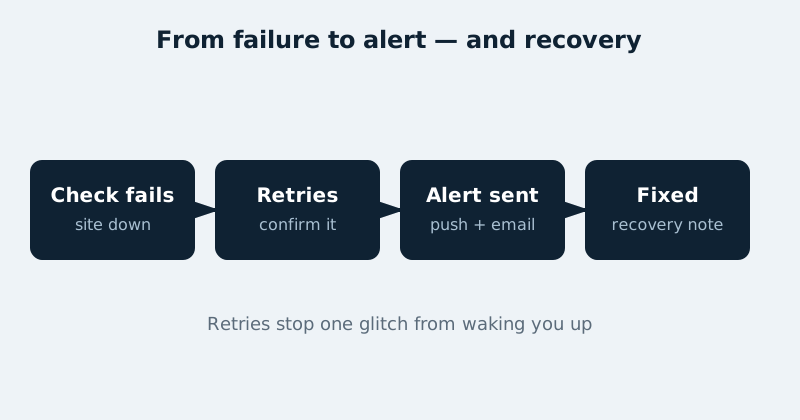
Monitoring fails socially before it fails technically: too many noisy alerts and the channel gets muted, then the real outage is missed. Prevent that with three habits. First, retries — require two or three consecutive failures before alerting, because home networks hiccup. Second, separation — route everything to one calm channel by default and reserve a loud channel (a push service with a persistent alarm, for example) for the two or three services that genuinely matter. Third, maintenance windows — when you are deliberately restarting the NAS or updating containers, pause the affected monitors in Kuma first. An alert that says “down, as expected, because you are updating it” still trains people to ignore alerts.
Common mistakes and troubleshooting
Everything shows down at once
That pattern means the checker, not the services: the host lost network or DNS, or Kuma’s container networking broke. Check whether the NAS itself can resolve and reach those addresses. A ping monitor for your router and one for a public address help separate “service down” from “internet down” at a glance.
HTTPS monitors fail with certificate errors
If a service uses a self-signed or internal certificate, the monitor will (correctly) distrust it. Either give the service a proper certificate through your reverse proxy, or tick “Ignore TLS/SSL error” on that one monitor — consciously, and only on your local network. Also read the certificate-expiry warning Kuma shows; an expired certificate is the most common cause of this symptom in the first place.
Notifications are configured but nothing arrives
Work the chain in order: does the Test button in Settings › Notifications succeed? If not, the provider credentials are wrong — bot tokens, chat IDs and SMTP app passwords are the usual culprits. If the test works but outages stay silent, the channel is probably not ticked on that monitor, or retries have not yet been exhausted, so the monitor has not formally flipped to down.
Kuma itself keeps restarting or loses its data
Almost always the /app/data volume is not actually persistent — a container recreated without the volume starts empty and asks you to create an admin account again. Confirm the volume mapping in your compose file points at a real folder or named volume on storage that survives restarts, and that the folder is writable.
Official documentation and references
- Uptime Kuma on GitHub — source code, releases and documentation
- Uptime Kuma Wiki — monitor types and advanced configuration
- Tecnativa docker-socket-proxy — the restricted socket proxy used for Docker monitoring
Frequently asked questions
How often should monitors check?
Sixty seconds is the sweet spot for important services: fast enough to catch an outage while it still matters, gentle enough to cost nothing. Five minutes is fine for secondary services. Checking every few seconds adds load and alert noise without meaningfully improving a home setup.
Can Uptime Kuma monitor things outside my home?
Yes — it checks any reachable URL, port or address, so it can watch a family website, a VPS, or a relative’s connection you help maintain. Remember the reverse is also true and more important: something outside your home should ideally watch your home, which is the second-instance pattern described above.
Is a status page safe to share?
A status page shows service names, up/down state and response history — no credentials and no access. Many people still keep theirs on the local network or behind their normal remote-access route, and share it only with household members. That is a reasonable default; publishing it publicly is a choice, not a requirement.