

Setting Up the Home Assistant Energy Dashboard
The Energy dashboard is Home Assistant's built-in answer to the question every smart home eventually asks: where is our electricity actually going? It tracks grid import and export, solar production, battery storage and individual devices in one place — but it is famously picky about its inputs. Get the sensor types right and setup takes fifteen minutes; get them wrong and your sensors simply never appear in the dropdowns.
Published Nov 17, 2026 · Last updated Nov 18, 2026
What you need
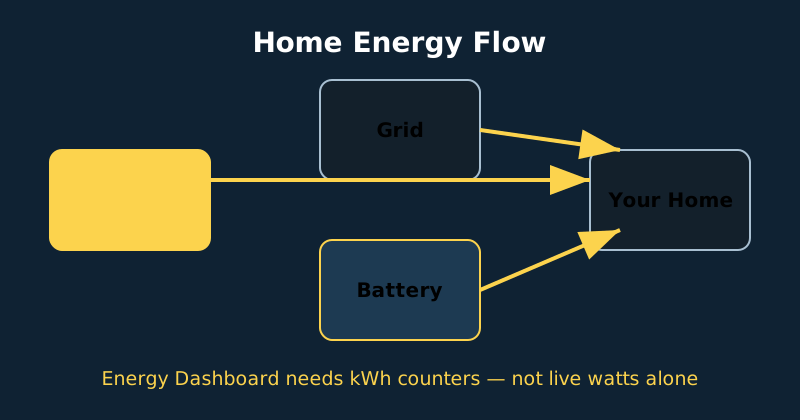
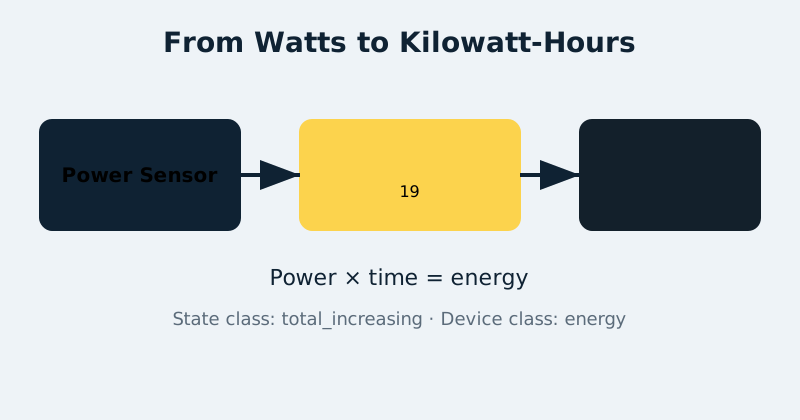
You need at least one cumulative energy sensor in Home Assistant, measured in kilowatt-hours. That might come from a whole-home monitor with CT clamps in your electrical panel, a smart meter integration, a solar inverter integration, or smart plugs with energy monitoring on individual appliances. The dashboard's requirements are strict and worth memorising: the entity must be a sensor with device class energy, a unit of kWh (or Wh), and a state class of total or total_increasing — meaning it counts ever upward like an odometer. The two are not interchangeable in every field, though: most Energy fields — grid consumption, solar production, battery charge and discharge — expect total_increasing specifically, so build helpers to that state class unless a particular field says otherwise. Live power readings in watts, however accurate, cannot be added directly, because the dashboard works in energy over time, not instantaneous flow. If your hardware only reports watts, do not worry: the Riemann sum integral helper described below converts power into energy. You can start with a single grid sensor and add solar, battery and per-device tracking later; the dashboard grows with your hardware.
Energy is not power
Power, in watts, is how fast electricity is flowing right now — a kettle draws about 2,000 W while it boils. Energy, in kilowatt-hours, is how much has flowed in total — that kettle running for half an hour uses about 1 kWh, roughly one billing unit. Utility bills, solar production and battery capacity are all energy figures, which is why the dashboard insists on kWh counters. Home Assistant builds its long-term statistics from those counters hourly, which also explains a common surprise: the Energy dashboard is not real-time. New data typically appears after an hour or two, and that delay is normal, not a fault.
Configure the dashboard step by step
- Audit your sensors first. In Developer Tools, check the States page for your candidate entities. Confirm each shows a kWh unit, energy device class and total_increasing state class. Anything missing an attribute will be invisible in the Energy settings, so fix it here, not later.
- Convert any watts-only devices. For each power-only sensor, create a Riemann sum helper as shown in the next section. Wait a few minutes and confirm the new sensor is accumulating in kWh.
- Open the Energy configuration. Go to Settings, then Dashboards, then Energy. This configuration screen is separate from the dashboard itself — a distinction that confuses many first-time users.
- Add grid consumption. Under Electricity grid, add your grid import sensor — the energy you buy. If you export solar, add the grid return sensor separately; import and export must be two counters, never one net figure.
- Add solar and battery if you have them. Solar takes your total production counter, not export. Battery storage needs two counters: energy charged in and energy discharged out, entered separately so self-consumption maths stays honest.
- Add costs. Enter your per-kWh import price, and export price if you are paid for it, as static prices or from a tariff sensor. Accurate costs turn the dashboard from a graph into a budgeting tool.
- Add individual devices. Under Individual devices, add energy-monitored plugs and appliances — the washer, dryer, water heater and EV charger are the revealing ones in most homes.
- Wait, then verify. Give the dashboard two hours, then compare its daily grid total against your meter reading or utility app. Small differences are normal; a total that is double or half usually means a sensor was added twice or a Wh sensor was treated as kWh.
# If a device only reports power (W), create energy (kWh) in the UI:
# Settings > Devices & Services > Helpers > Create Helper
# > Integration - Riemann sum integral
#   Source:      sensor.water_heater_power
#   Method:      Trapezoidal
#   Unit prefix: k
#   Round:       2
#
# The same helper in YAML (configuration.yaml):
sensor:
  - platform: integration
    source: sensor.water_heater_power
    name: Water heater energy
    unit_prefix: k
    round: 2
    method: trapezoidal
Choose the trapezoidal method for most loads: it averages between readings and handles appliances that switch on and off far better than assuming a constant draw. Left method suits sensors that update very frequently. Either way, the helper produces a total_increasing kWh sensor the dashboard accepts. One warning: if a source sensor resets to zero on every reboot — or drops to unavailable and comes back at zero — it corrupts your totals. Check statistics after the first restart and know what to look for: the energy total stepping backwards, or a single-hour spike roughly equal to the counter's whole value, means a reset leaked into your history. Home Assistant's Utility Meter helper is the companion tool here — it watches a cumulative counter, absorbs source resets instead of passing them through, and produces daily, weekly or monthly versions with clean resets of its own, which is how you build bill-matching views.
Reading the dashboard like an owner
Once data flows, three views earn their keep. The sources chart shows, hour by hour, whether the house ran on solar, battery or grid — the fastest way to spot a load that should be rescheduled into sunshine. The device breakdown ranks individual appliances; in most homes it produces one surprise, usually an ageing water heater, a pool pump or a forgotten space heater, that pays for the whole monitoring project. The cost view, checked monthly against the real bill, validates your sensors: if Home Assistant and the utility agree within a few percent, you can trust every automation you build on the data, such as starting the dishwasher when export rises or alerting when overnight baseload creeps upward week after week.
Common mistakes and troubleshooting
The number one problem is a sensor missing from the dropdown, and it is almost always an attribute problem: watts instead of kWh, a missing state class, or a template sensor where you forgot to declare the device class and unit. Check attributes in Developer Tools before changing anything else. Second, do not feed the dashboard a net grid sensor that goes up and down; split positive and negative flows into import and export counters, using template sensors if your meter only exposes one signed value. Third, never add the same physical measurement twice — a whole-home counter plus a solar counter that already includes it will double-count production. If totals look wrong after a sensor replacement, use the Statistics tools to fix or clear the bad hours rather than deleting the whole history. Finally, remember the hourly delay before declaring failure; configure in the morning and judge in the afternoon.
Official documentation and references
- Home Assistant documentation — the Energy dashboard and its data model
- Home Assistant documentation — the Utility Meter helper for tariffs and cycles
- Home Assistant documentation — the Riemann sum (integration) sensor behind energy estimates
- Home Assistant documentation — the recorder and long-term statistics
FAQ
Why does my power sensor not appear in the Energy settings?
Because the dashboard only accepts cumulative energy sensors in kWh or Wh with an energy device class and a total or total_increasing state class. Convert watts with a Riemann sum integral helper first, then the new kWh sensor will appear.
Can I use the Energy dashboard without solar or a battery?
Yes. A single grid consumption sensor is a complete, useful setup, and per-device monitoring often delivers the biggest savings in homes without solar. Solar, battery, gas and water sections simply stay hidden until you add matching sensors.
How accurate is a Riemann sum sensor compared with a real meter?
With frequent updates and a stable power sensor, the trapezoidal method gives a useful energy estimate — plenty for finding waste and timing appliances. Accuracy varies with the update interval and how abruptly loads change, so treat it as monitoring-grade, not billing-grade: it will not match a revenue-grade meter exactly, and very spiky, short loads are where the errors live.
Related guides
- ESPHome for Beginners
- Building a Home Assistant Dashboard
- Switches and Sensors Guide
- Home Assistant Automations Explained
Gear for this build
Prices are editorial and change often; buttons show live prices. Some links may earn a commission at no cost to you — see the disclosure page.